Businesses are going all-in on Instagram Stories, which means measuring your success through Instagram Stories analytics will become a crucial part of your social strategy this year.
But in order to create a winning Instagram Stories strategy, you need to have a clear idea of how to measure your performance.
So how can you tell what’s working and what isn’t?
In this post, we walk you through the ins and outs of your Instagram Stories analytics, what each metric means, and how you can use this knowledge to improve your Instagram Stories strategy:

Join over 1 million marketers to get social news, trends, and tips right to your inbox!
Email AddressUnderstanding Your Instagram Stories Analytics
Similar to the analytics for your Instagram posts and account, your Instagram Stories analytics can found by tapping the Insights button from the top right corner of your Instagram business profile (If you haven’t converted to a business profile yet, learn how to do it in our step-by-step guide).
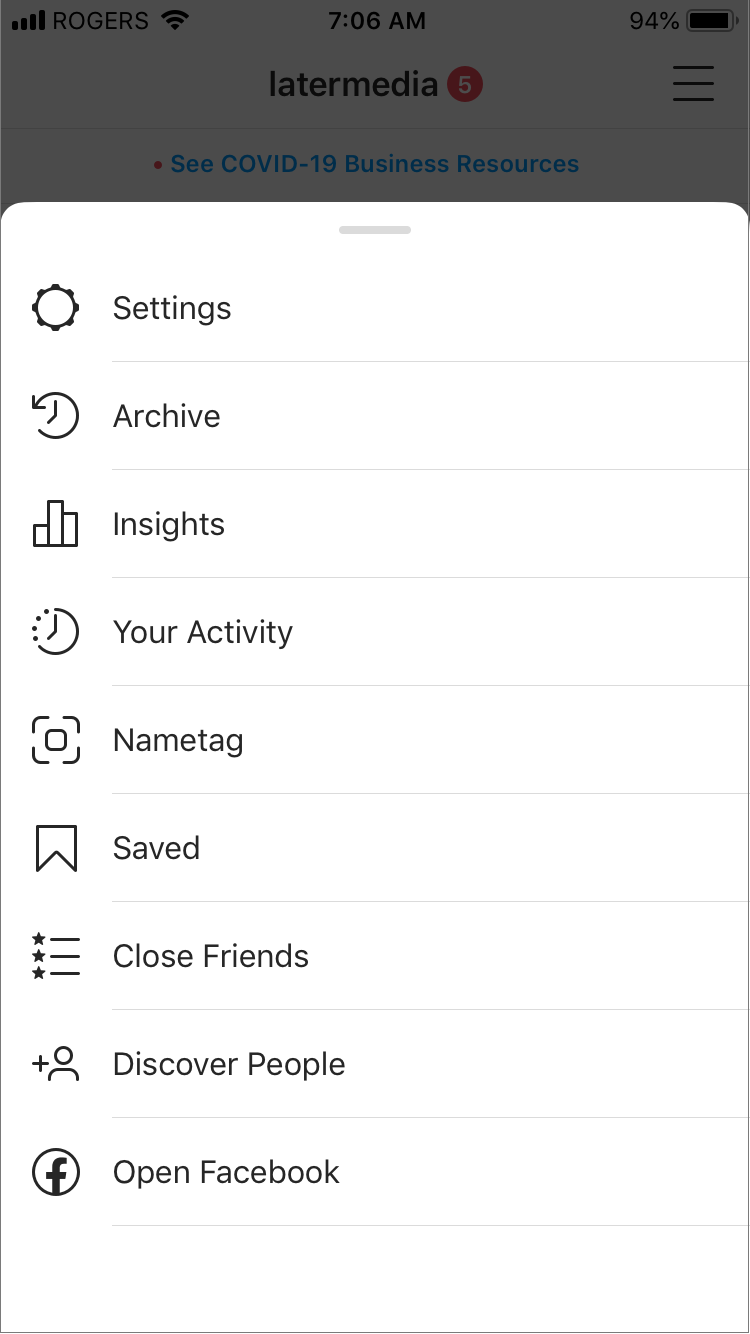
Once you open your Instagram Insights, switch to the “Content” tab at the top of the screen. Here you’ll see data for your regular Instagram posts, Instagram Stories, and any promotions you’re running.
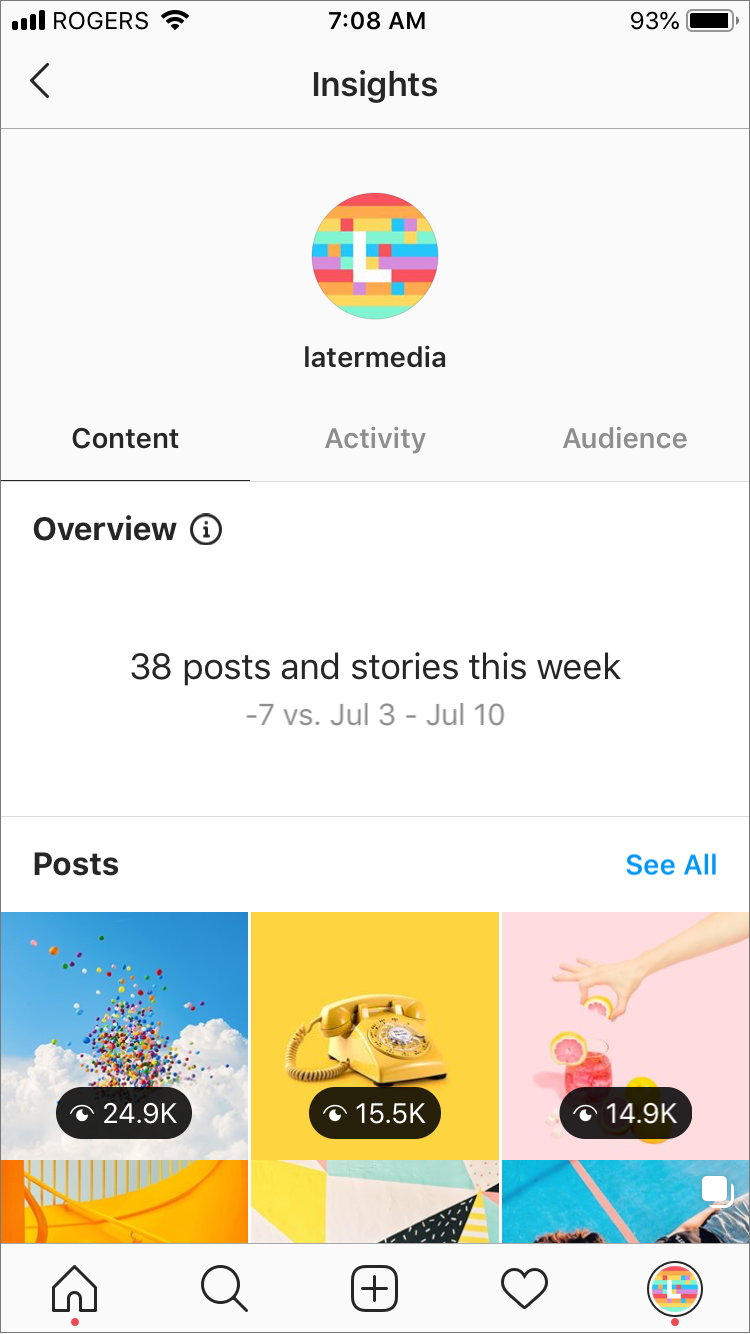
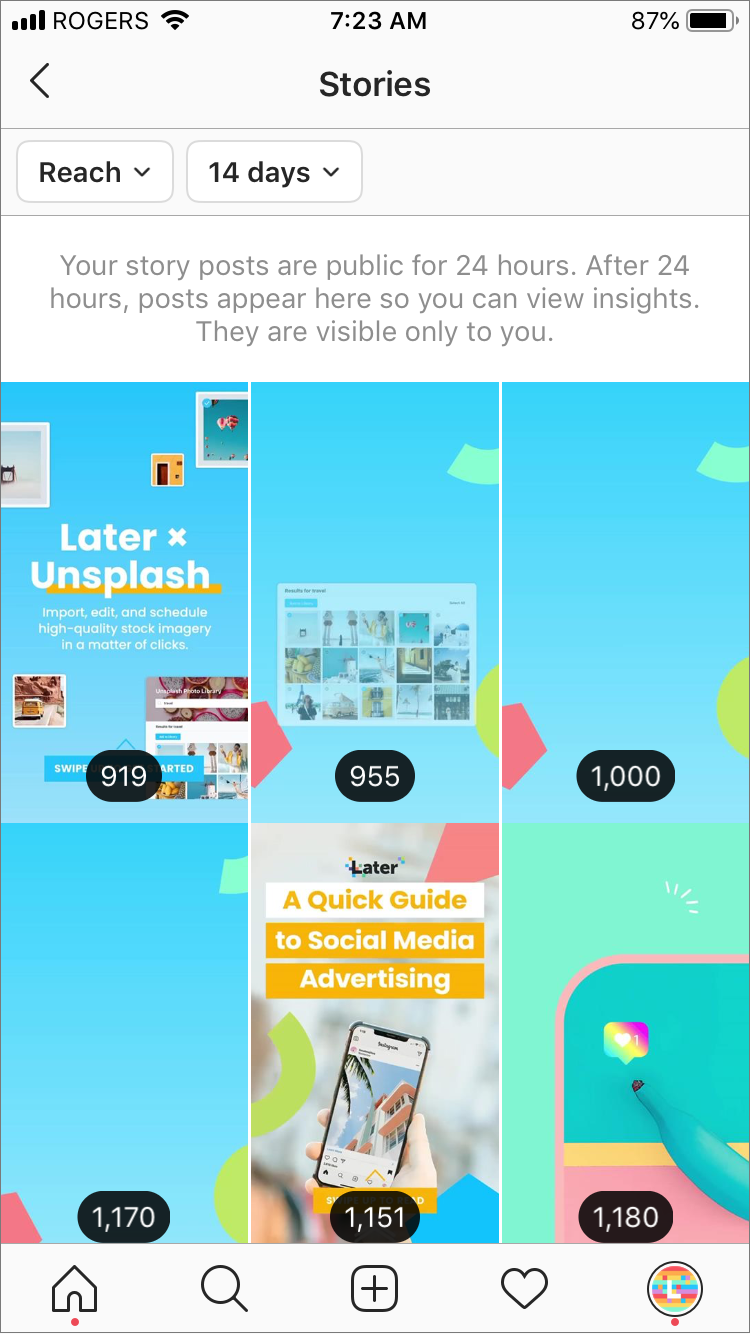
If you click on the See All button next to Stories, you can filter out metrics by date range and type of interaction.
You can also access these insights by swiping up on an active story. Doing so will pull up a number of important metrics about that story, including link clicks, profile visits, impressions, and a ton more!
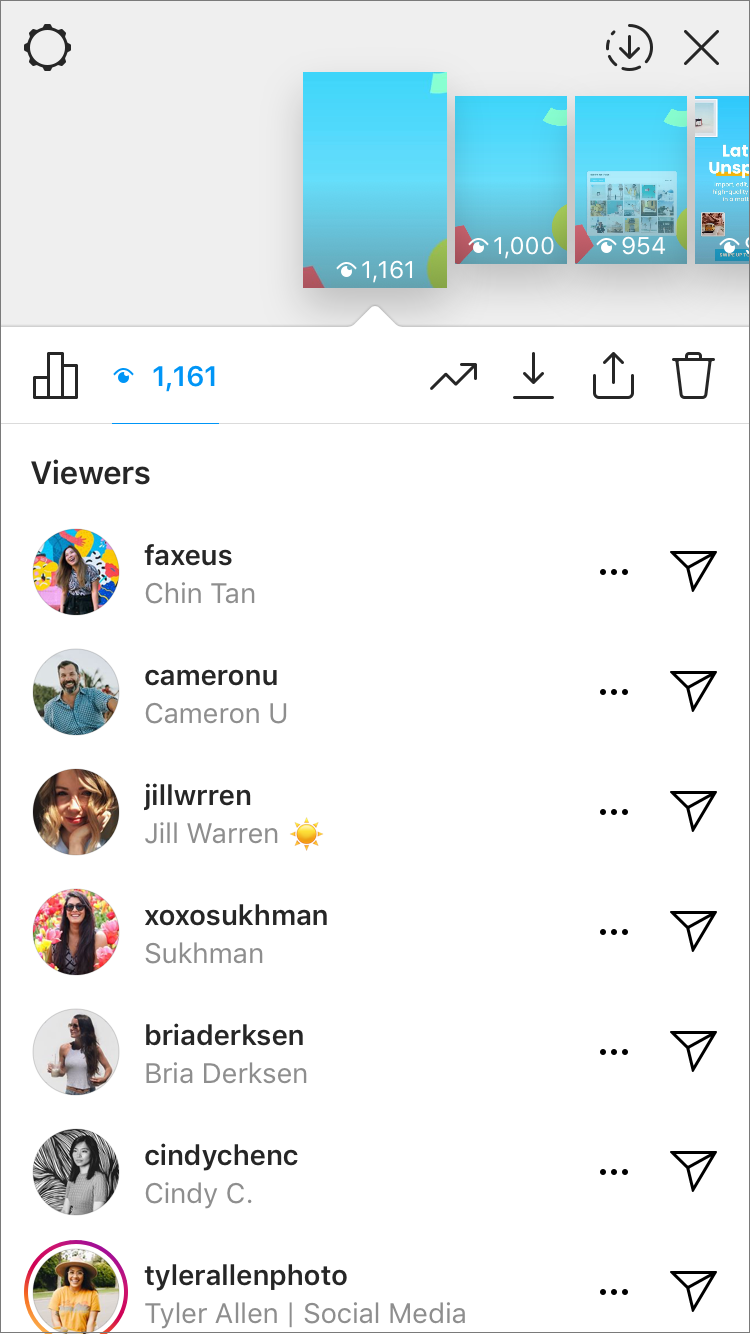
And now with Instagram’s Creator Studio, both businesses and creators can get access to Instagram Stories growth insights, along with the ability to map new and existing content to net follower changes.
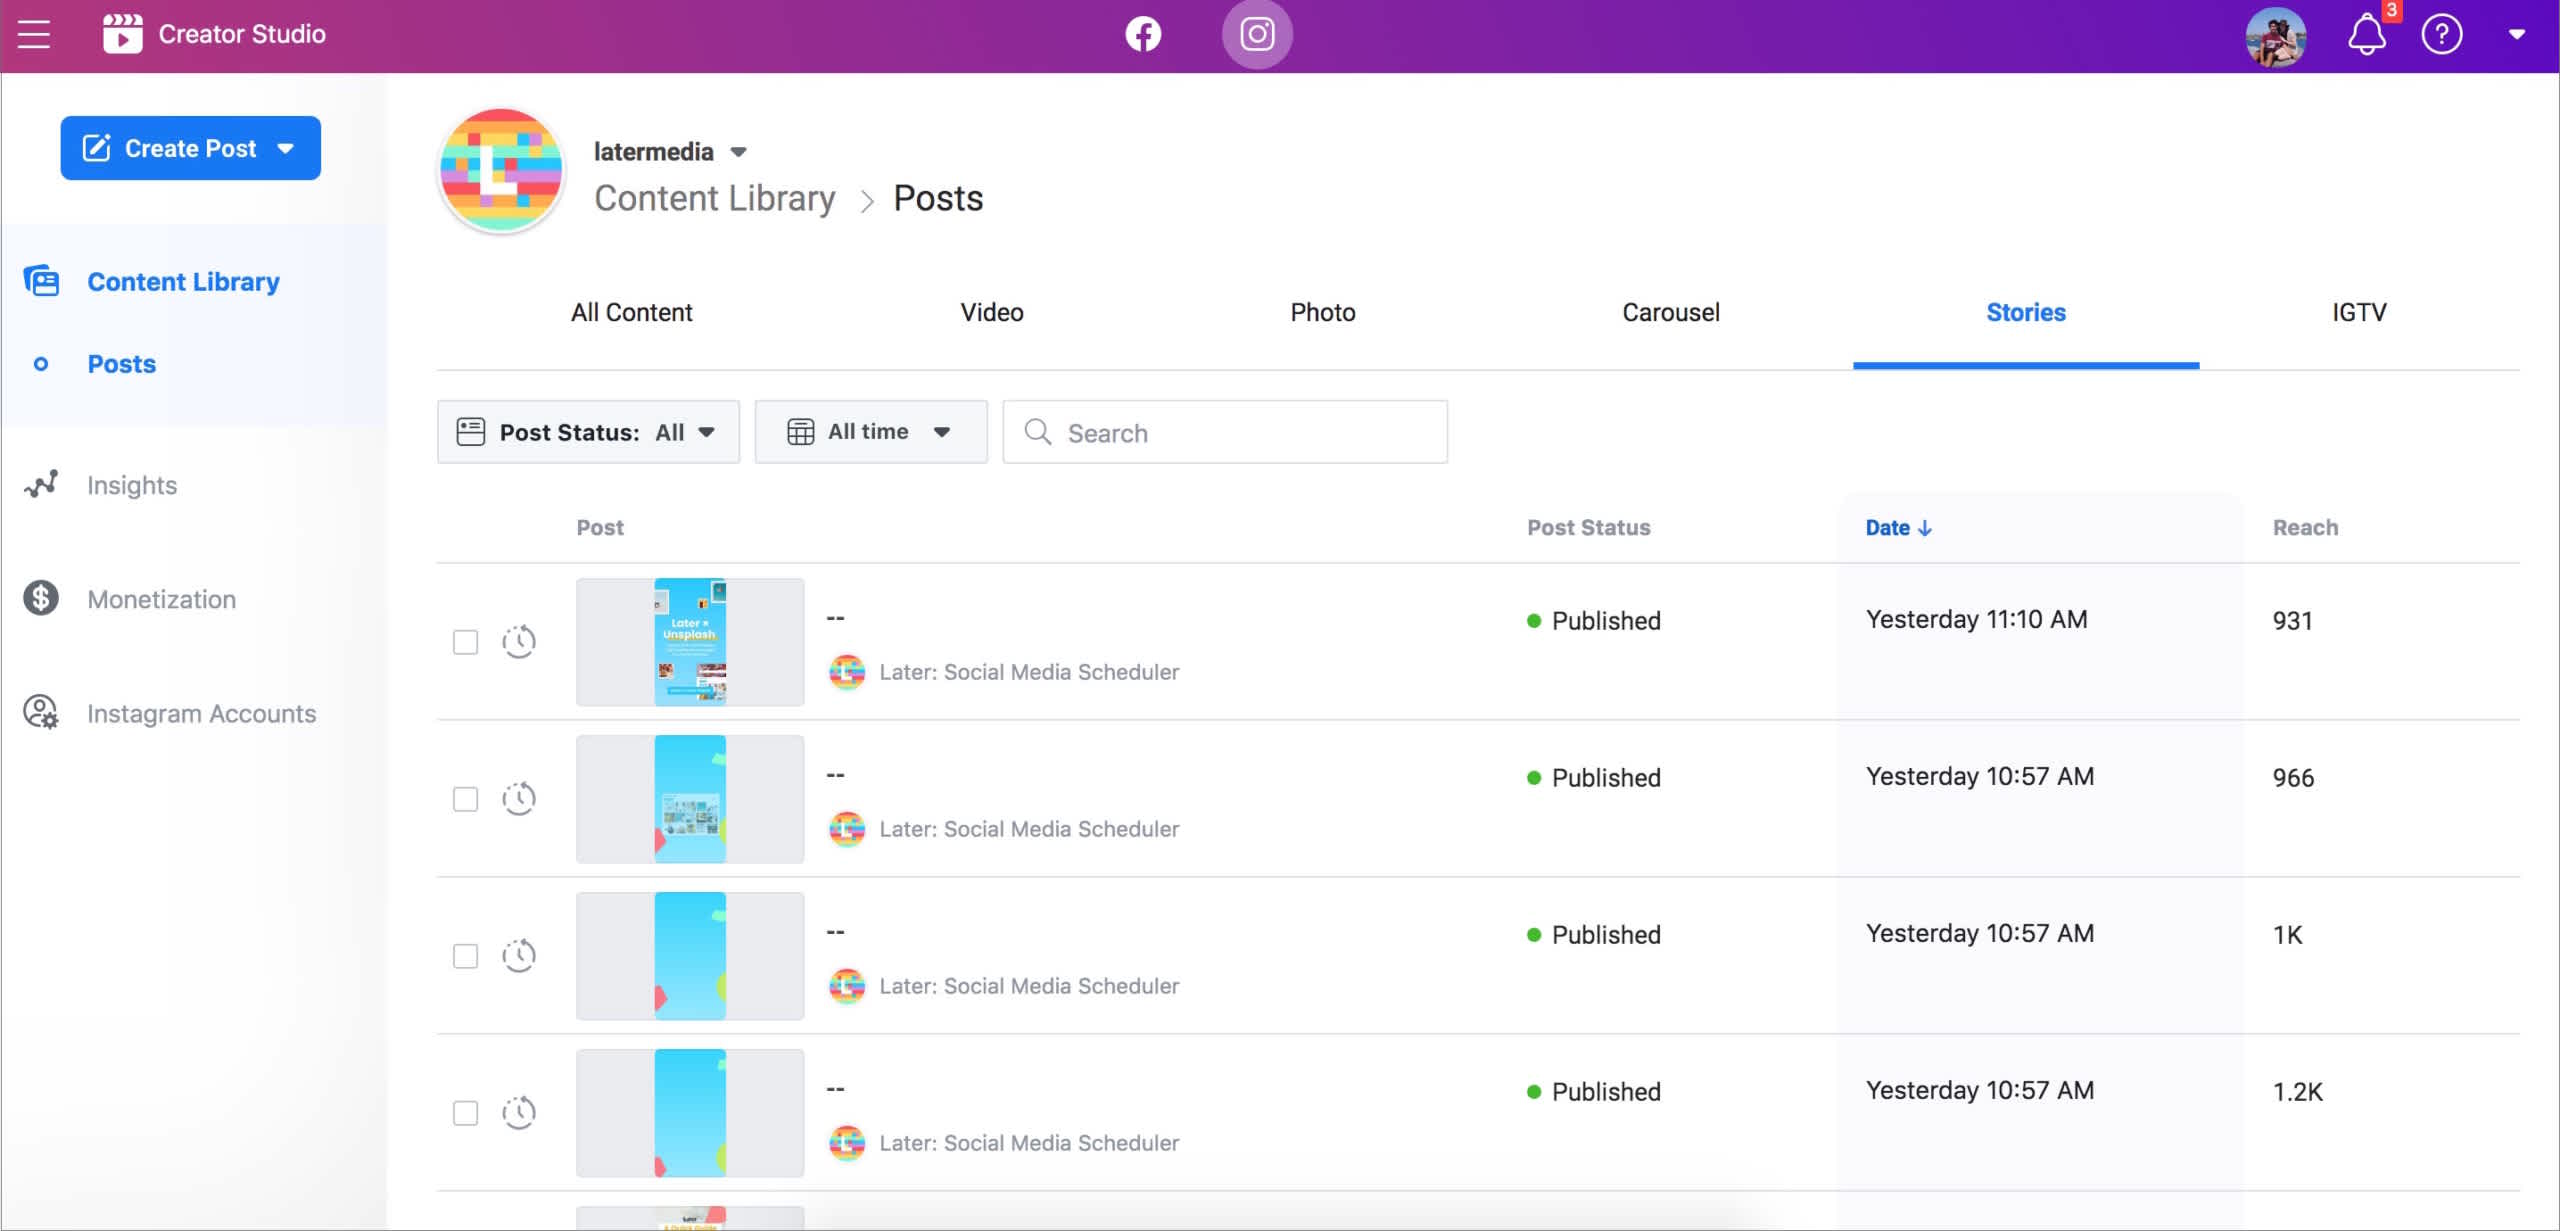
To access your Instagram Stories analytics on the Creator Studio dashboard, Select Content Library, and then click Stories. From here, you can sort individual stories slides by post status, date, and reach.
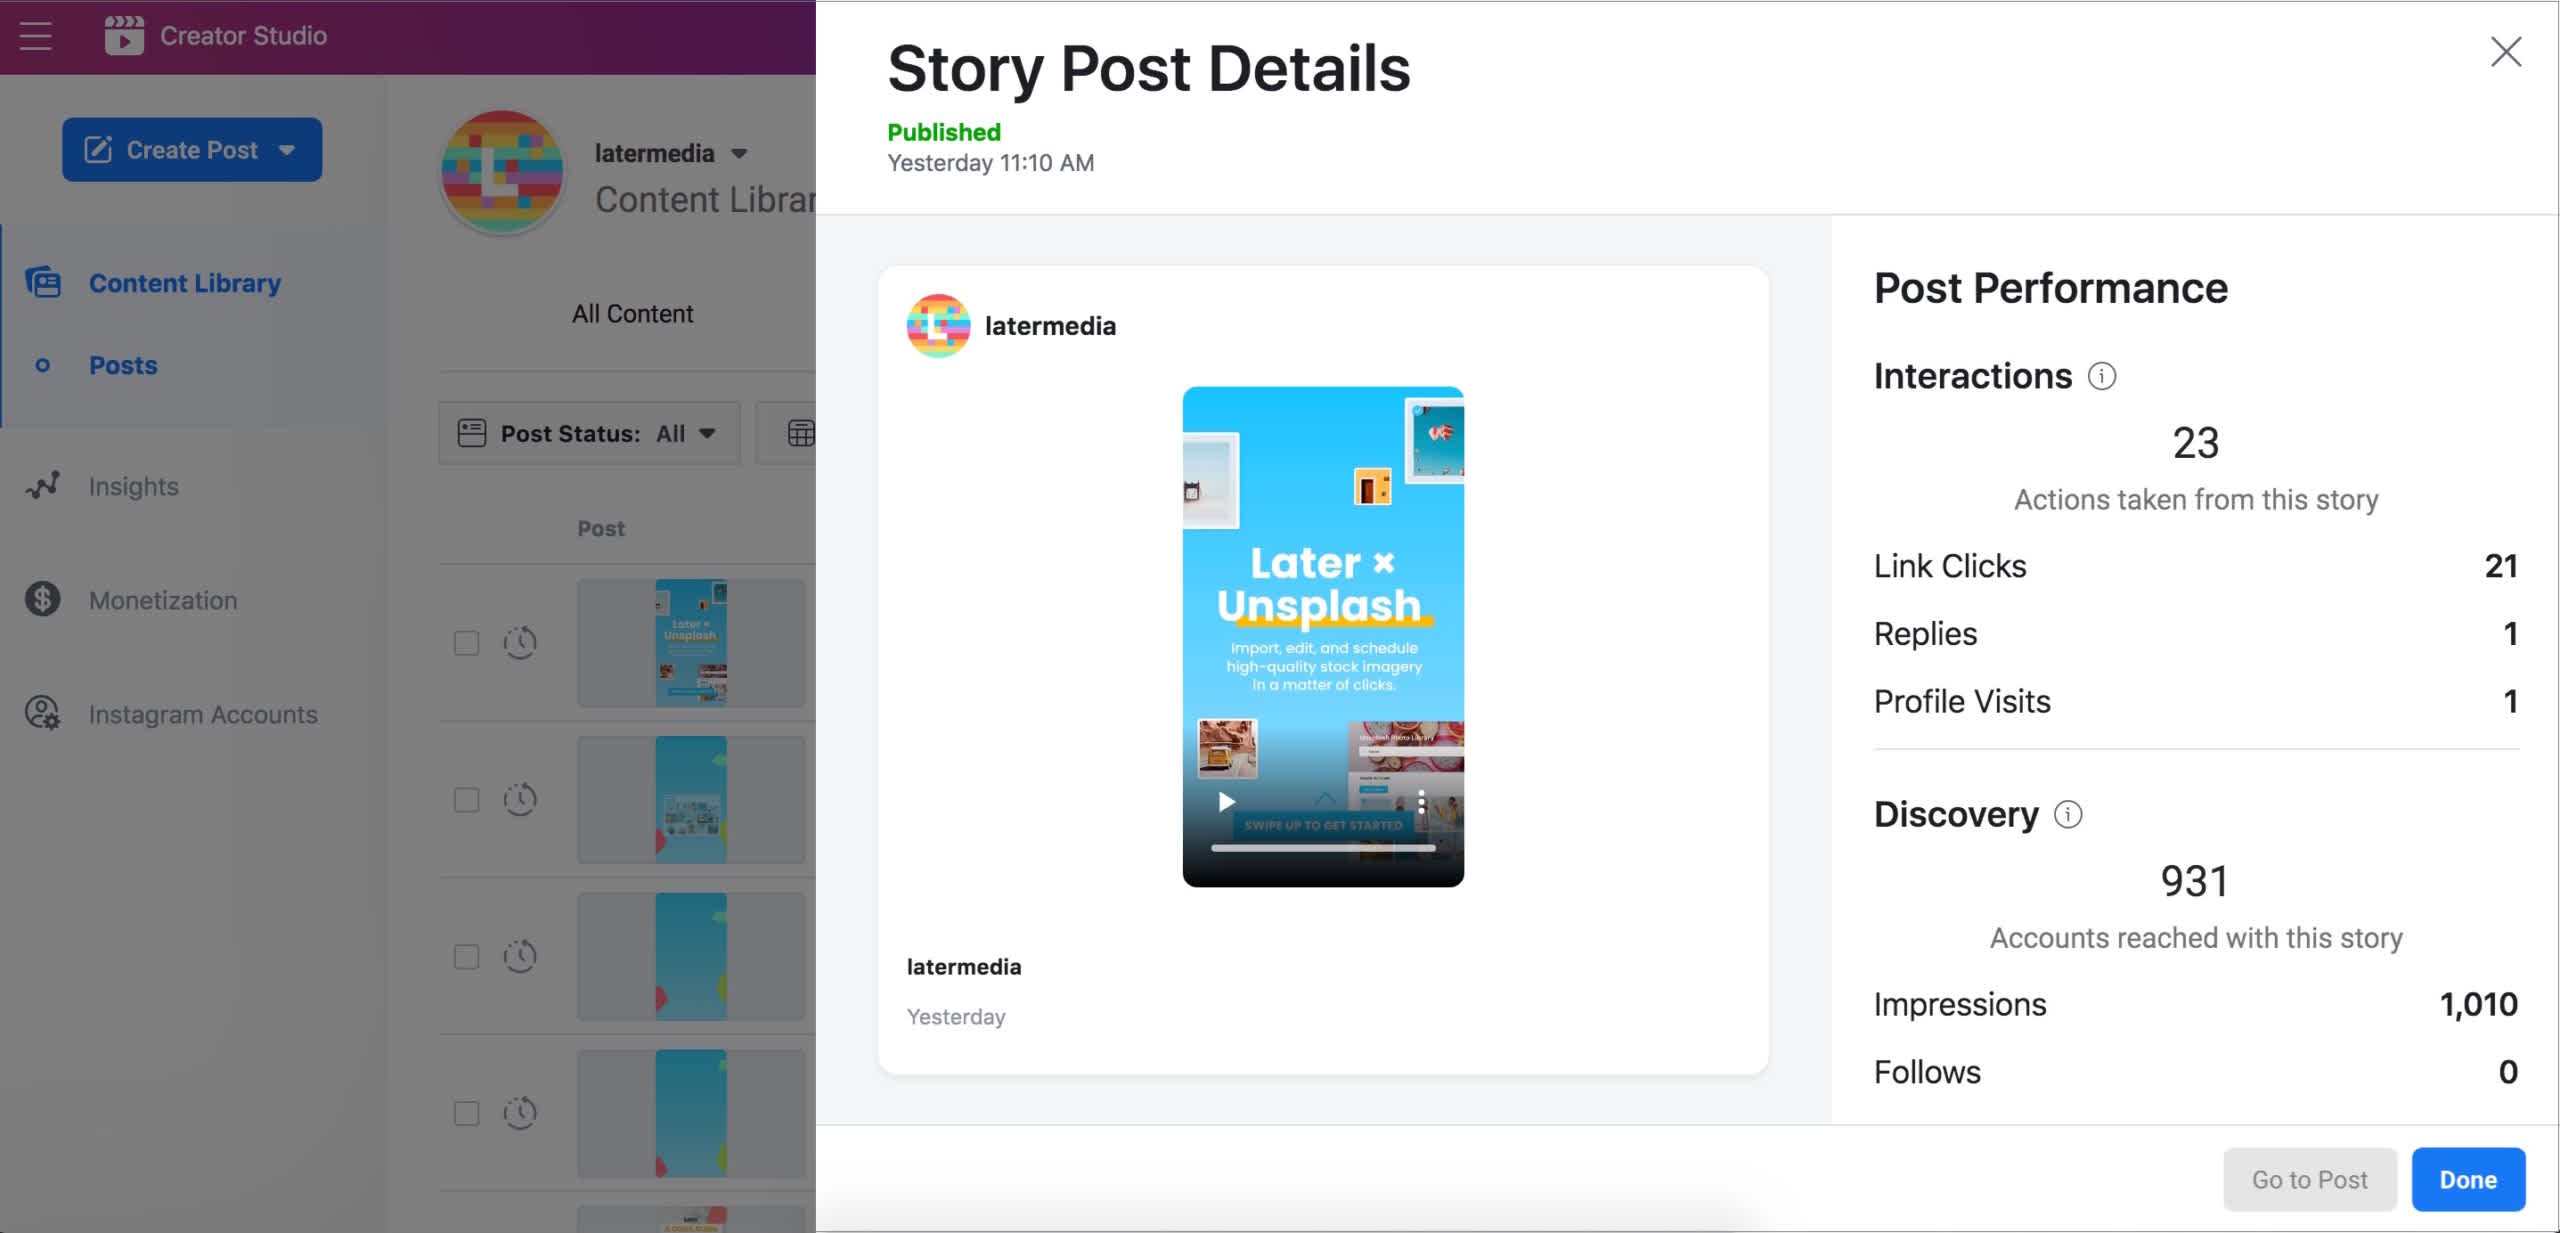
To hone in on individual metrics for each story slide, just click the slide to view its analytics:
Instagram creator profiles also have access to follow/unfollow data, which will make it easier than ever to determine what content is and isn’t resonating with your followers.
Previously, influencers looked outside the Instagram app for follow/unfollow data, until Instagram’s API changes disabled many of these third-party apps.
Influencers also have access to data around when their followers are online, growth insights, and new discovery data.
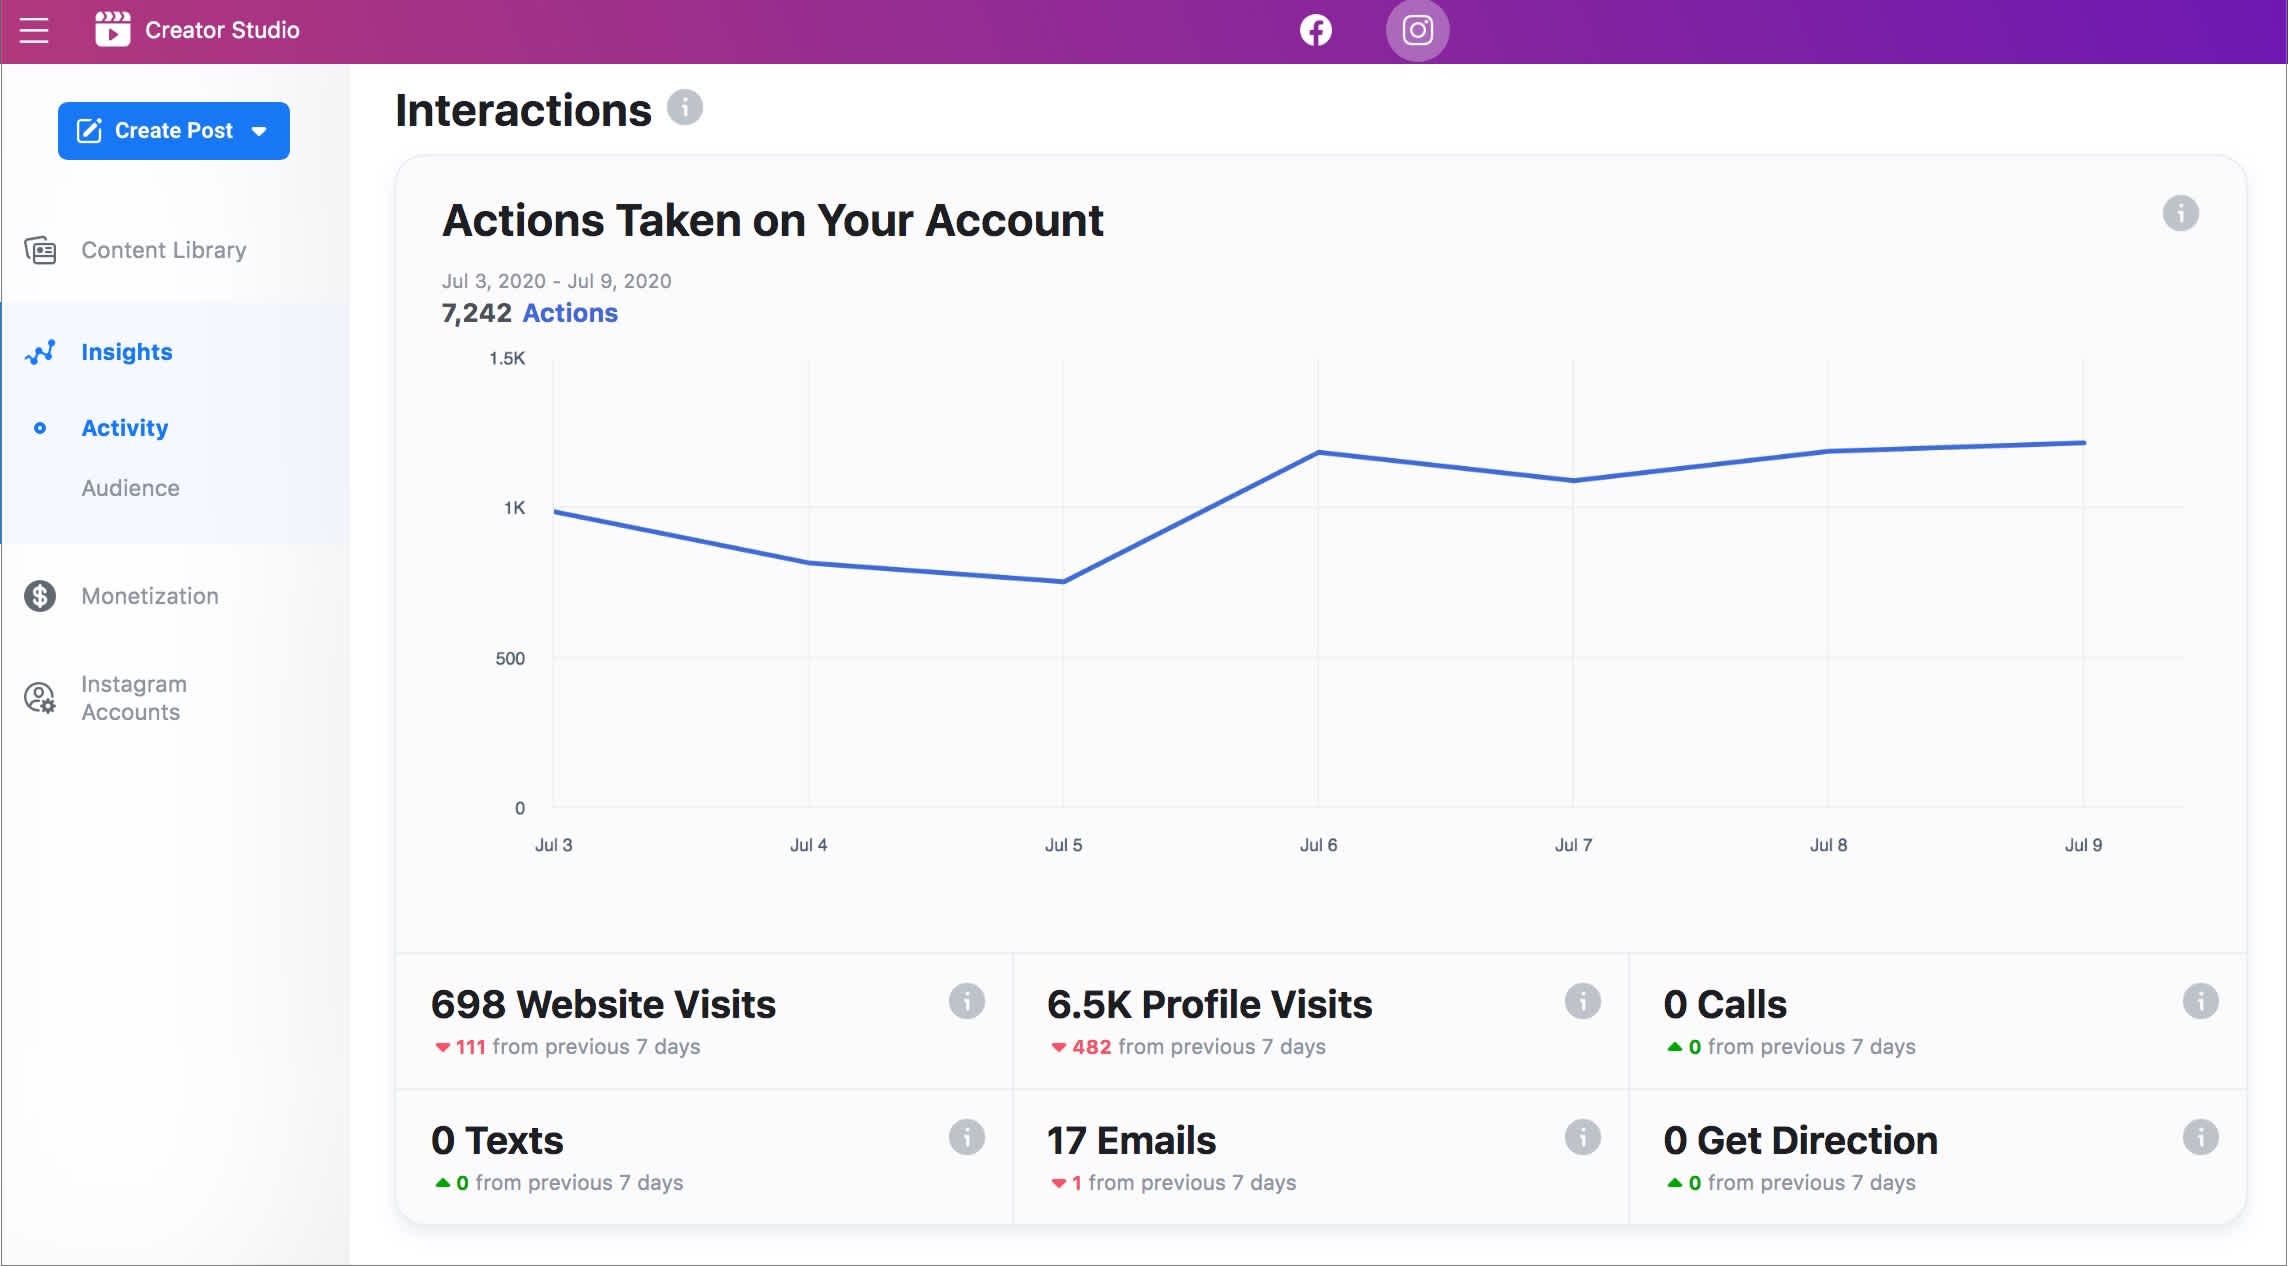
As reach and engagement continue to be a top concern for influencers, the Instagram creator growth metrics will give them insights into ways they can better reach their followers.
While many of these analytics are currently offered within the Instagram business profile, the Creator Studio dashboard makes it easier for users to access their metrics directly from their desktop.
Looking to optimize your Instagram Stories strategy this year? Take our free 45-minute Instagram Stories course to learn how to design beautiful stories and capitalize on all the latest features.
Below, we’ll breakdown each of the different Instagram Stories metrics and how they can help you optimize your strategy:
What is the Difference Between Reach & Impressions in Instagram Stories Analytics?
Reach and Impressions both help you understand the size of your Instagram Stories audience, but what’s the difference between them?
Reach is the number of visits a unique account viewed each slide in your story, while impressions are the total number of views on each of your individual Instagram Stories.
Impressions go a step deeper than reach, offering relevant data including when someone has watched your story more than once. If your total impressions are higher than your reach, this means your story was replayed multiple times.
Your impressions will often be higher than your reach, but never the other way around.
If you notice that your reach is declining, you may want to rethink the type of content you share. Don’t be afraid to switch things up (just make sure to track when you do!) to find out what your audience is most interested in seeing.
Luckily, there are a ton of creative features you can use to improve your Instagram Stories content within the app! Using these features in a consistent way can add a ton of personality to your stories and help you build a loyal following.

Did you know you can also track and measure your Instagram Stories performance and analytics with Later?
And unlike the analytics in the Instagram app, which only saves your stories metrics for 2 weeks, you’ll be able to analyze up to 3 months’ worth of Instagram Stories with Later!
Simply log into your Later account and navigate to the Analytics tab. Here you can see how your Instagram Stories are performing and rank them by impressions, reach, completion rate, reply count, and more.
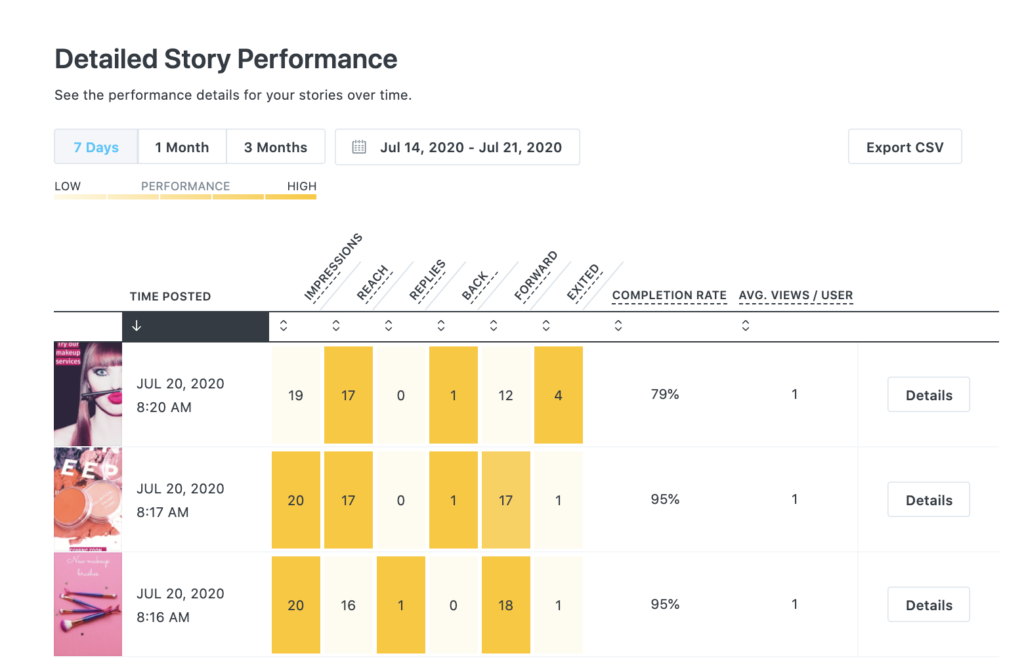
You can also hone-in on your individual stories to learn more about how each of them performed over time. To do this, just click the Details button to pull up a graphical representation of how your story has performed across impression, reach, and more.
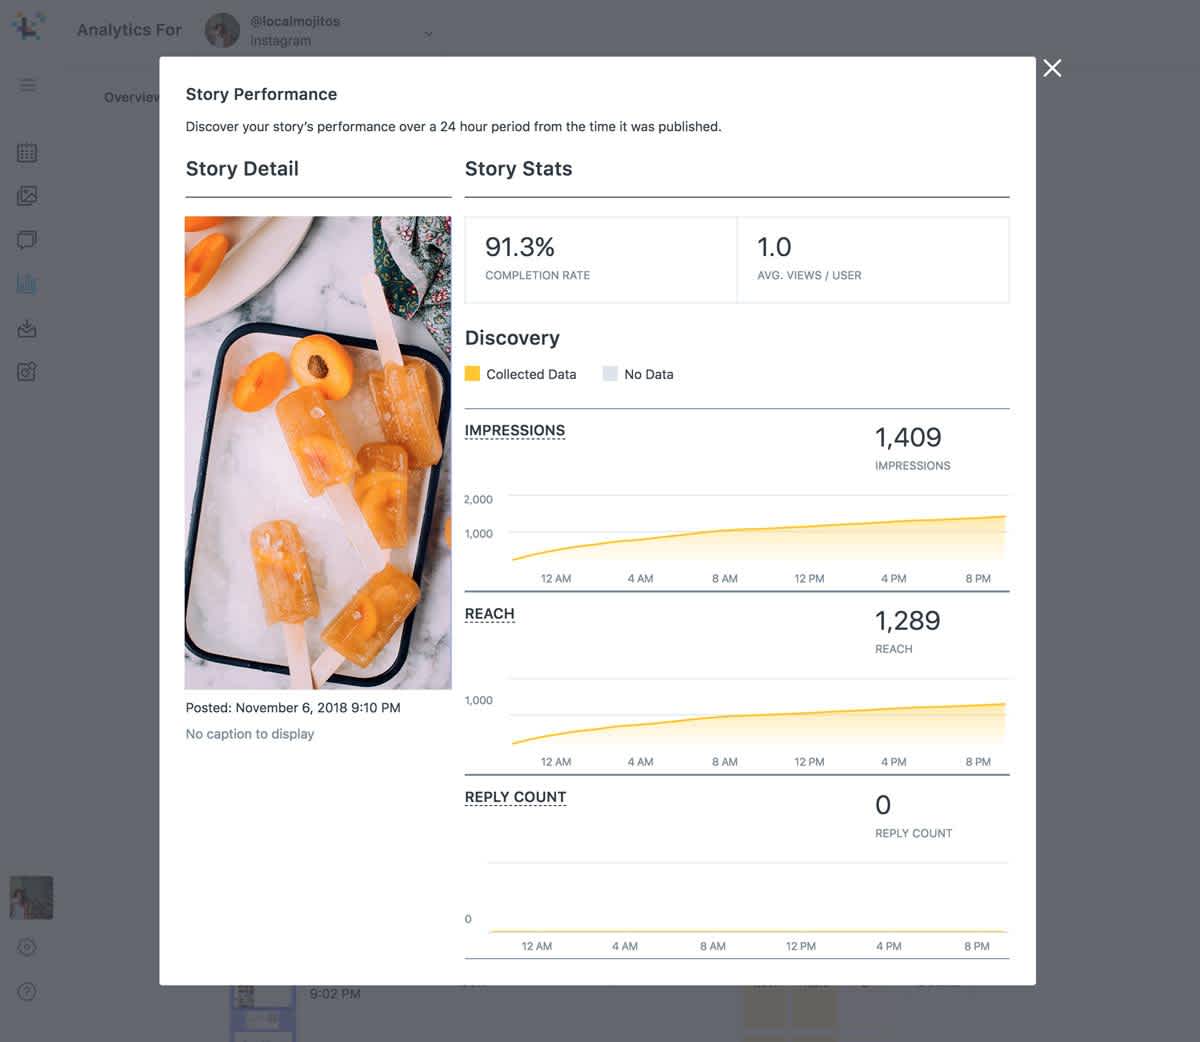
Note: As an Instagram Partner, Later uses the Instagram API for all Instagram analytics, which does not include data for swipe ups, profile clicks, or sticker taps in stories.
Upgrade to a Later paid plan for access to Instagram Stories analytics and all the other Pro Analytics features, like engagement rates, audience analytics, and Linkin.bio tracking.
Instagram Stories Analytics: How to Find Your Stories Completion Rate
Instagram Stories analytics also offers data on how viewers interact with your Instagram Stories, so you can find out crucial information about how many people are engaging with your entire story.
If you view a single slide in your story, you’ll notice a list of metrics, including forward, back, next story, and exits.
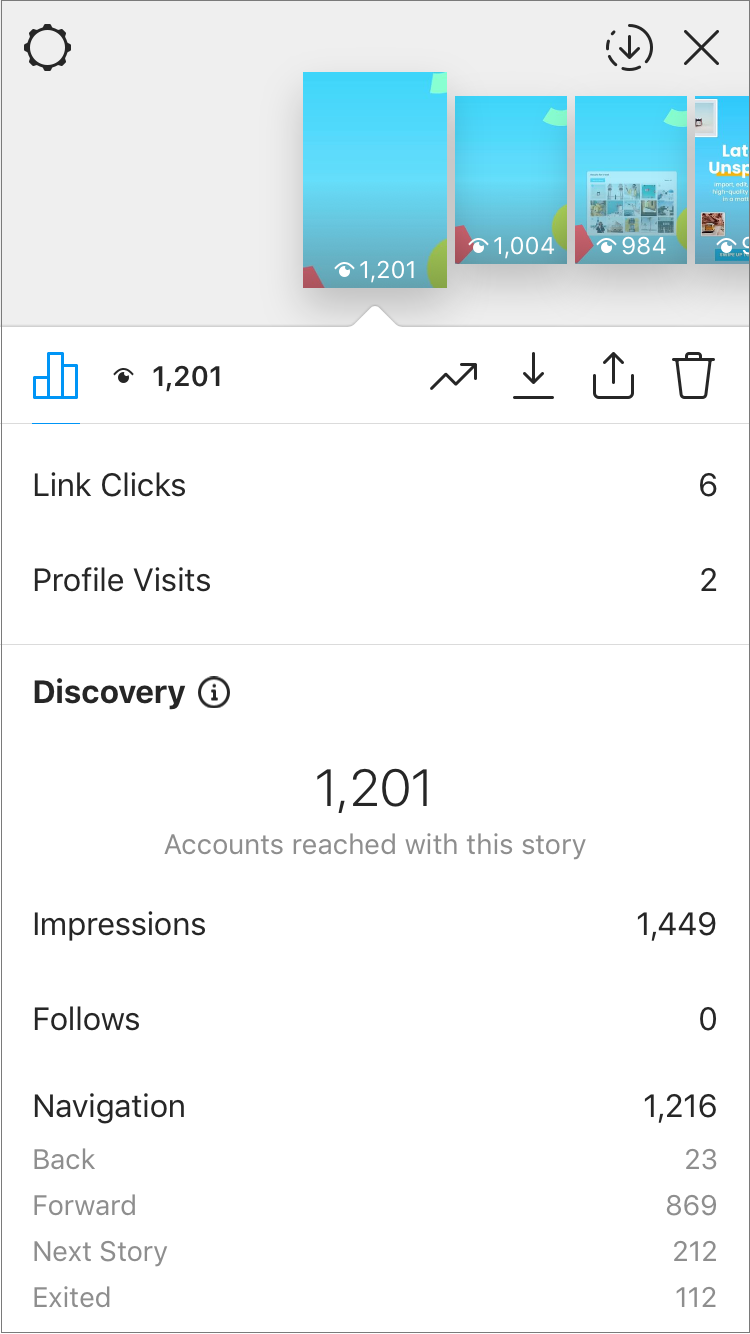
This type of engagement data for Instagram Stories analytics is great for finding out what types of content perform the best, so you can determine what you should be posting more of! Here’s what each of them means:
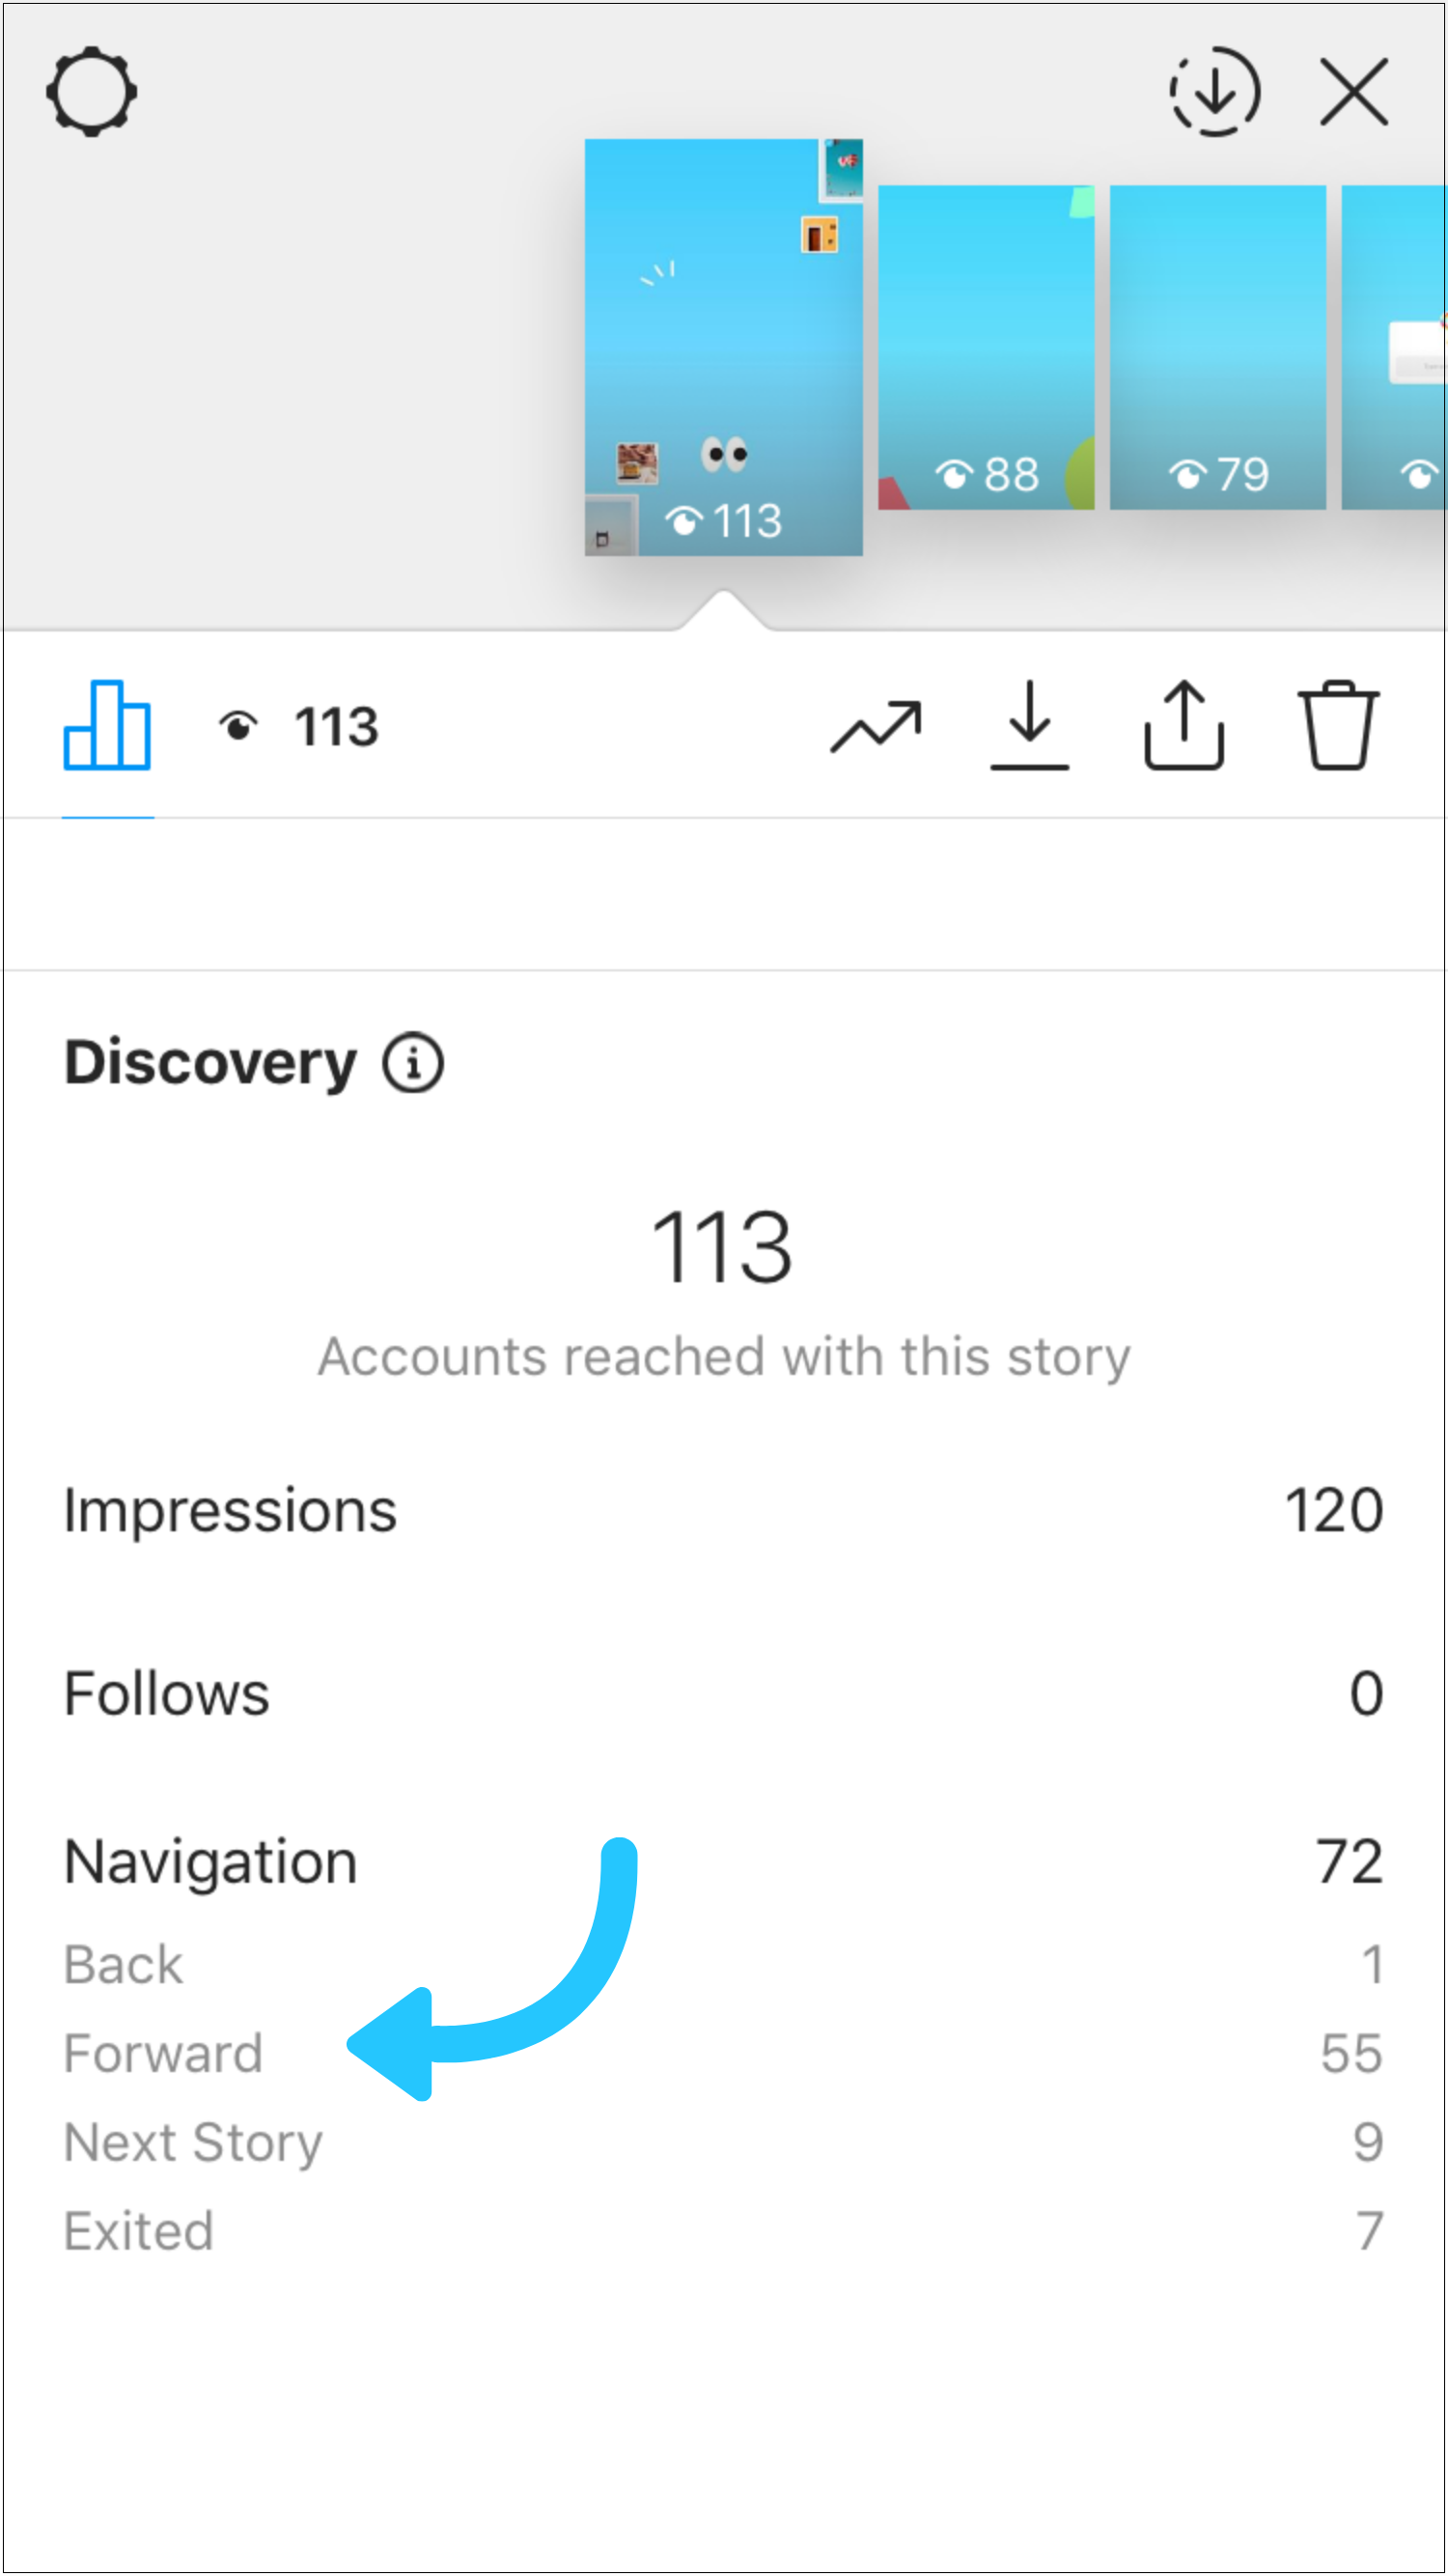
Taps Forward
Taps forward is the number of times a viewer tapped the right side of the screen to jump to the next story in the queue. Since a lot of people “speed tap” their way through watching Instagram Stories, taps backward, next story, and exits are all better indications of how your stories are performing.
For example, if you’re running an Instagram account for an online sneaker store, you’ll want to pay attention to how different types of content perform against each other.
Is your audience most engaged when you’re sharing product photos? Or do they tend to prefer behind-the-scenes footage? Are they swiping away from photos but tapping forward on video content?
Tracking these kinds of metrics can help you find out now not just how similar content performs, but how different content buckets perform against each other.
Taps Backward
Taps backward is the number of times a viewer tapped the left side of the screen to rewatch the previous story.
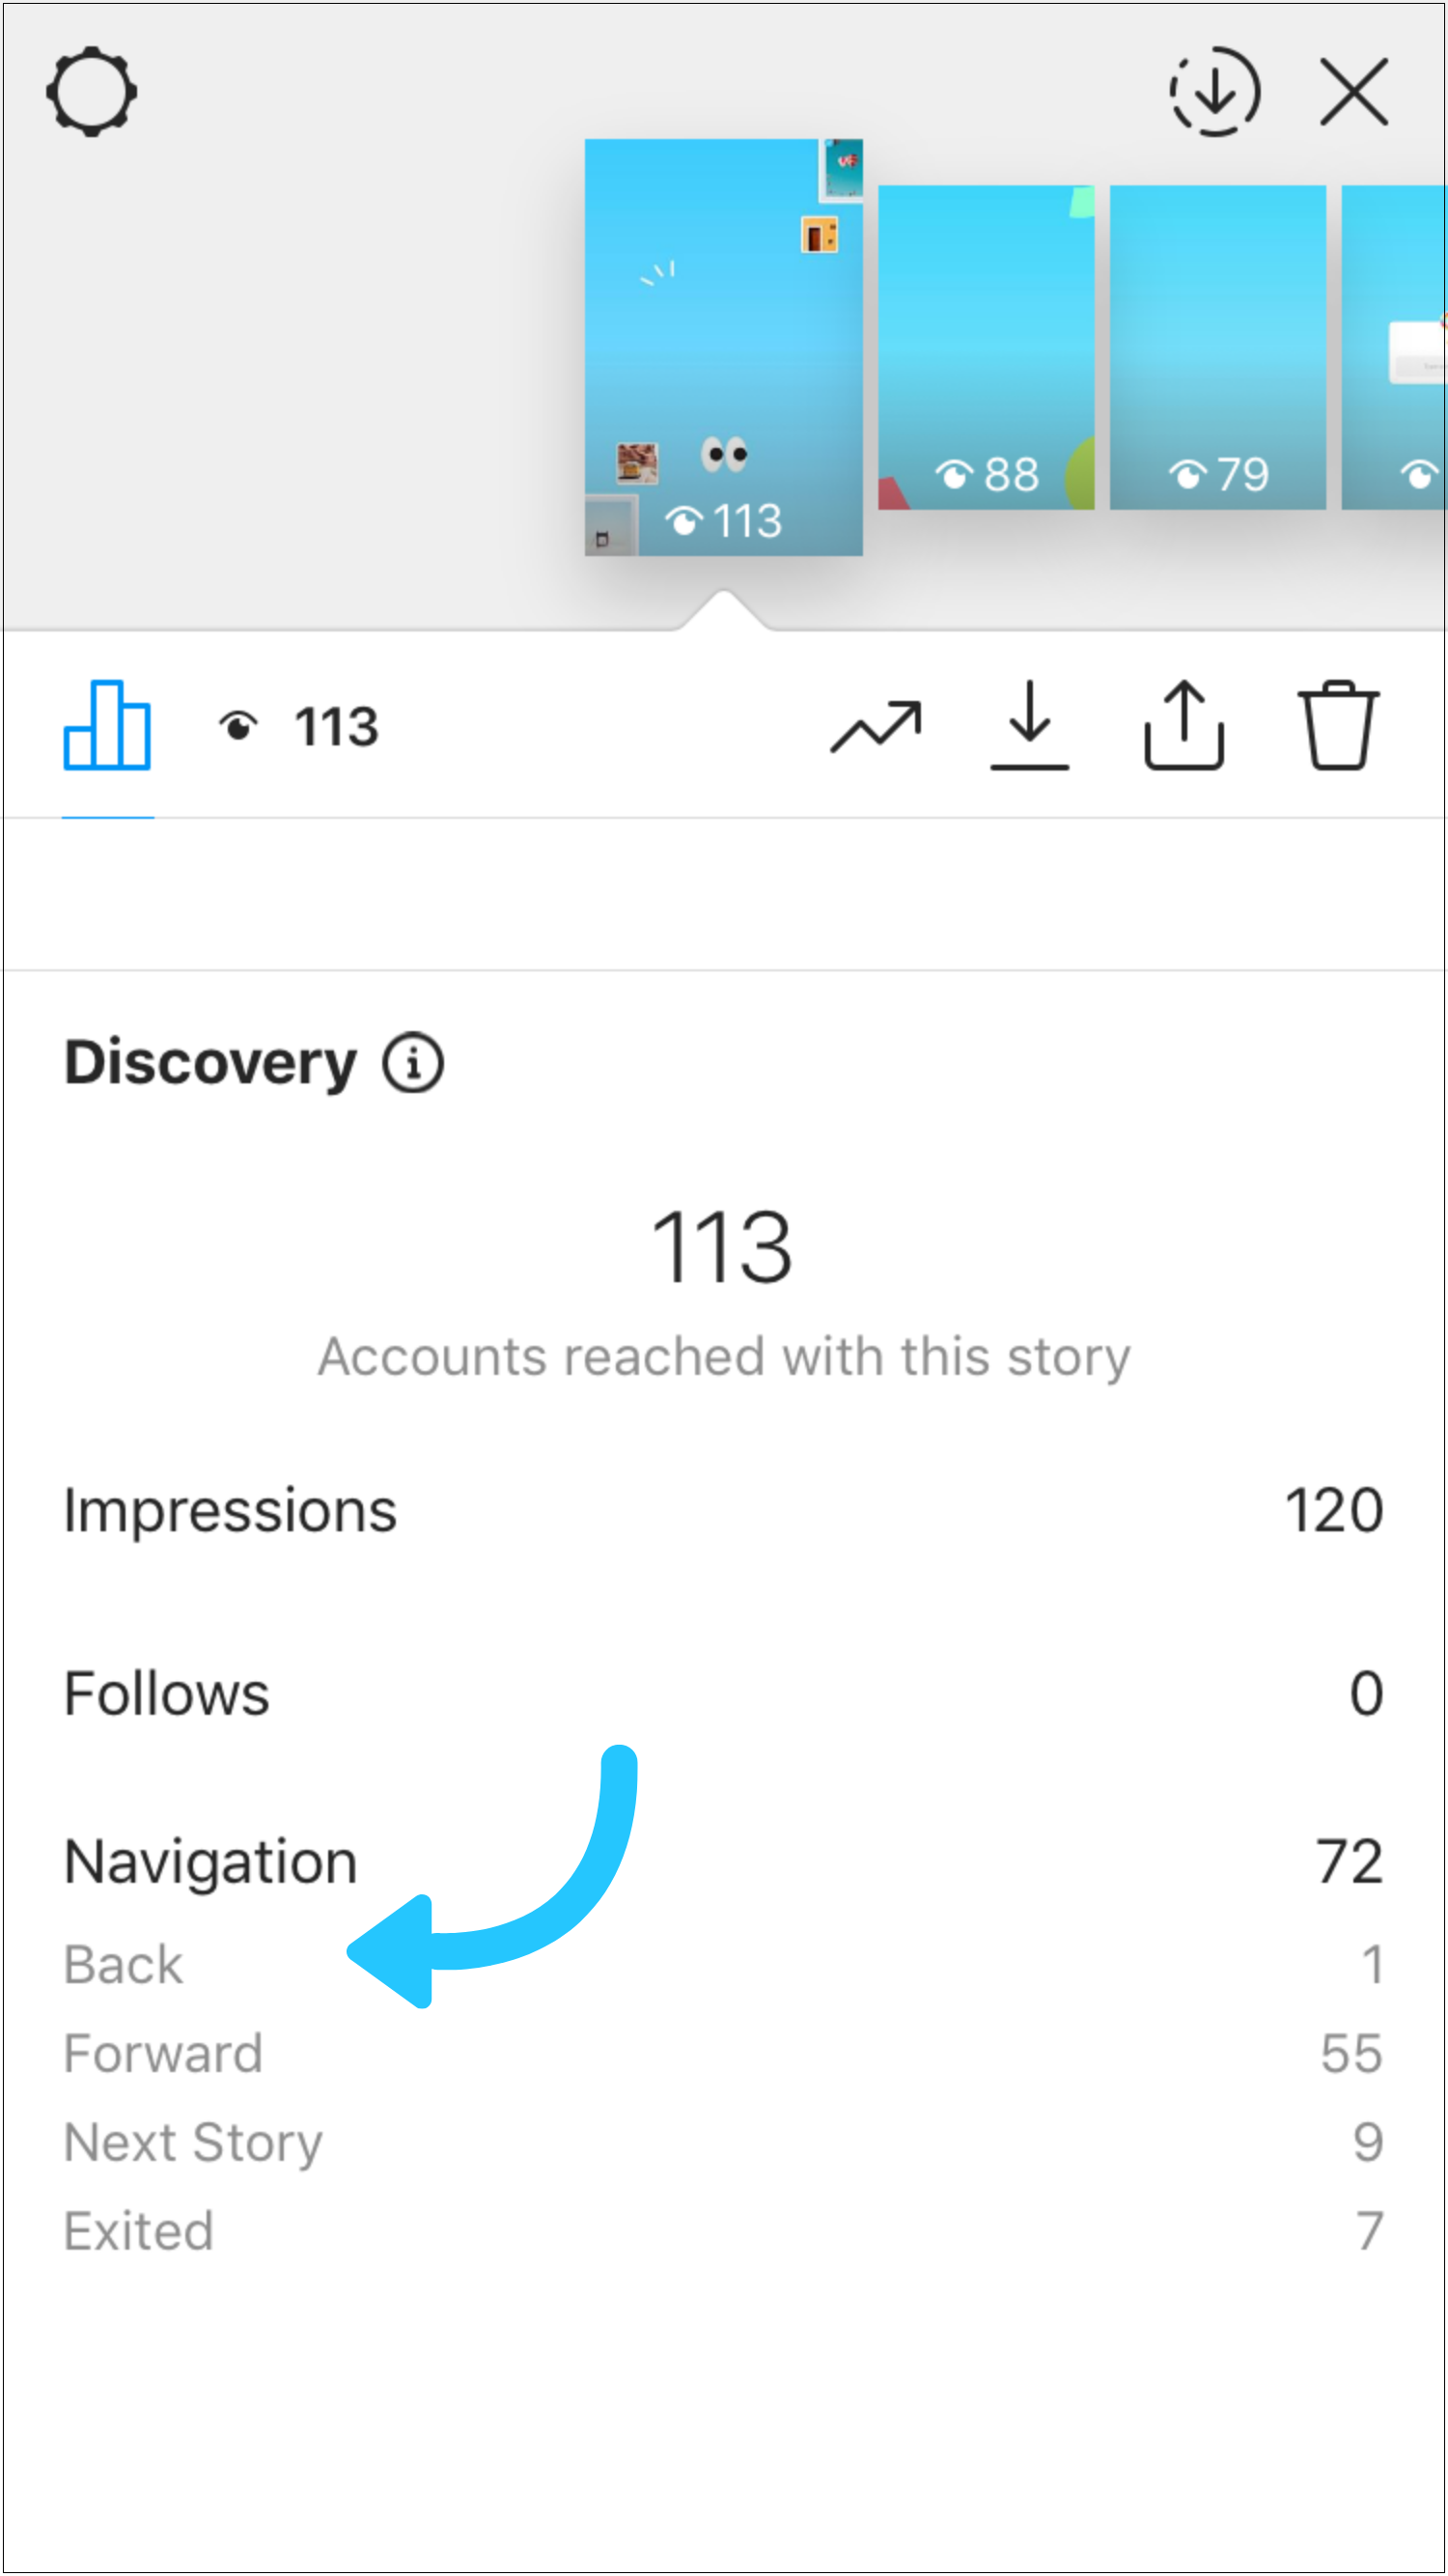
This can be a great sign of what’s working!
When a viewer taps backward, it can mean they think content is worth re-watching or that it caught their attention while they were speed tapping through their stories. If a post has a lot of taps backward, make note of the type of content, and keep testing it in your future stories!
This is one of the best ways to unlock new trends and find out what works for your audience.
Next Story & Exits
Exits are the number of times someone has swiped out of your story, while next story indicates the number of taps to the next account’s story.
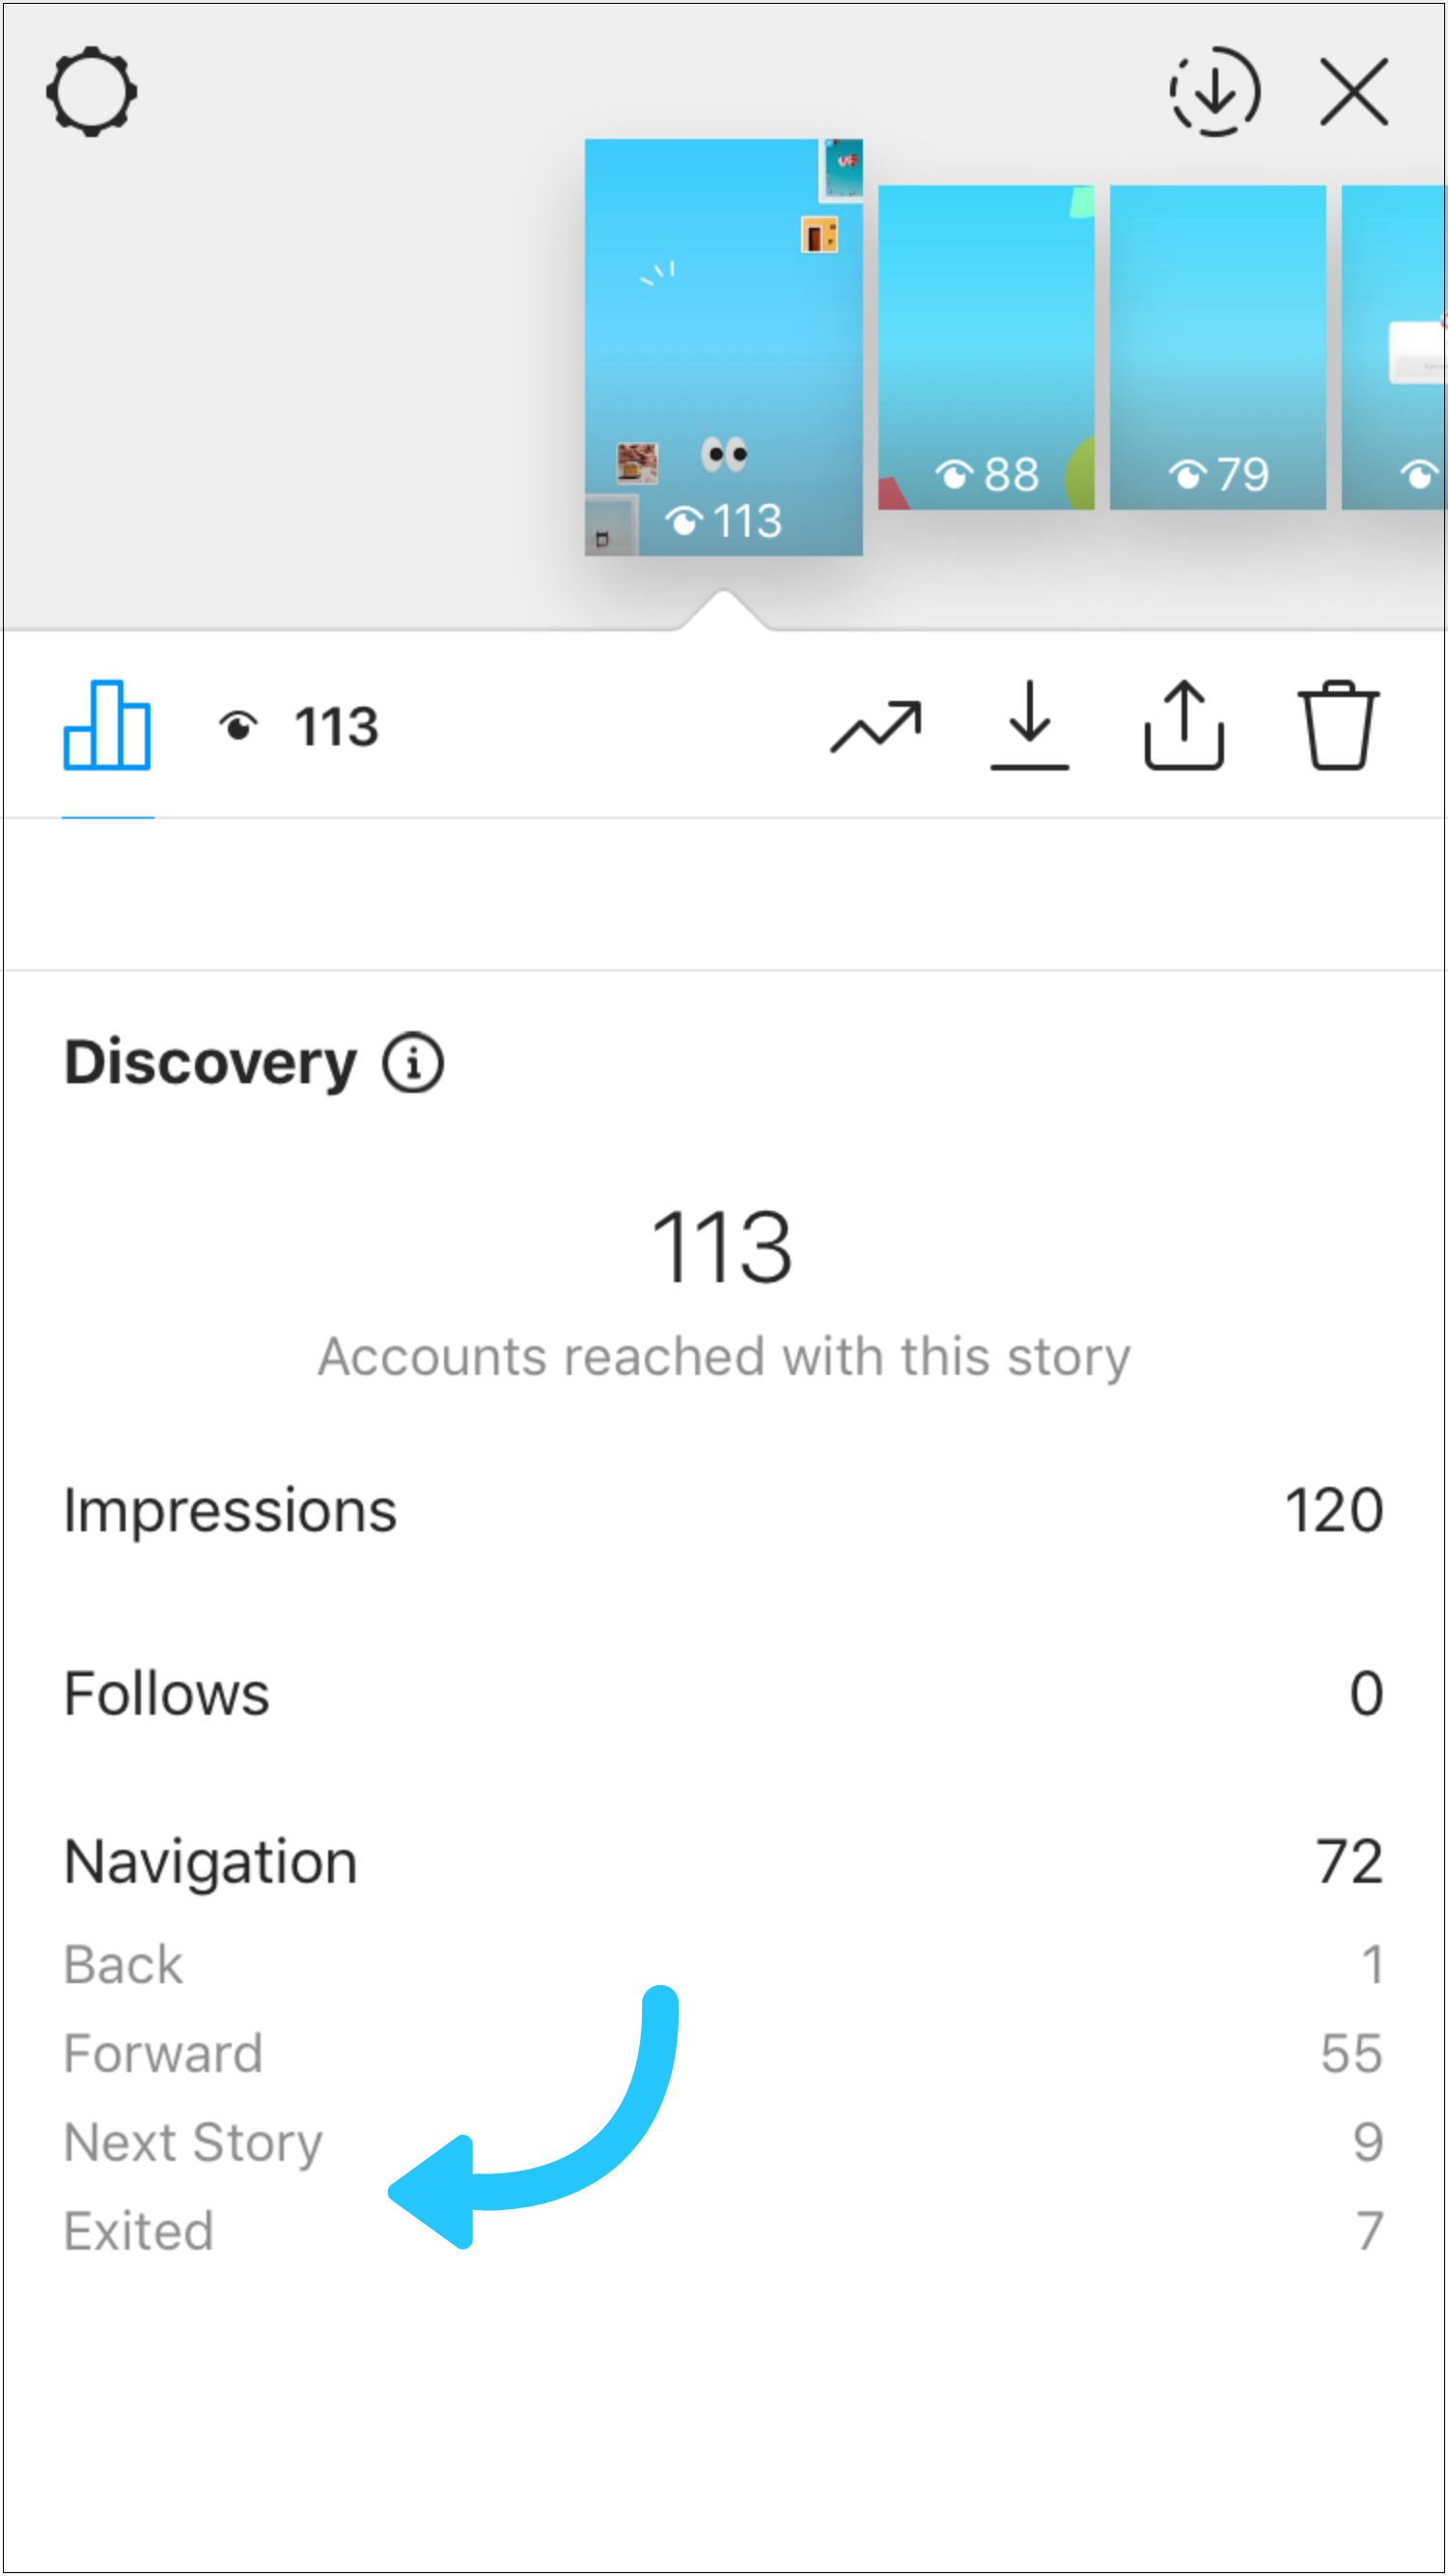
While these two metrics are similar, exits have a less negative connotation. For example, if someone exits your story, it could just mean that the viewer was running out of time to watch stories. Also, if you include a clickable link in your story, they may have swiped up to learn more.
Next story is more of an indicator that the viewer was over watching your story and wanted to skip to the next one. This data can help you determine how long your optimal Instagram Stories posts should be, whether it’s 3 slides or 13 slides.
These metrics can also be incredibly telling and show where in your content strategy you can improve to keep your audience’s attention. If you’re seeing a lot of nexts or exits for your stories, you may want to consider reviewing the quality of your content.
You always want to create content that’s interesting enough to keep your audience tapping through to the end and coming back for more!
How to Measure Engagement with Instagram Stories Analytics
Instagram Stories analytics also tracks the types of interactions your Instagram Stories receive. These interactions are broken down into swipe-ups and replies.
Swipe-Ups
Last year, Instagram rolled out the ability to add links to Instagram Stories and it’s a pretty big deal. In fact, it’s the first time ever that users can add links to Instagram that aren’t the link in their bio! (The feature is currently only available Instagram business profiles with 10,000+ followers and accounts that are verified).

Whether you use clickable links to drive traffic to your web campaigns, product pages, or blog posts, tracking the number of times users “swipe up” on your Instagram Stories is a great way to figure out what kinds of content are best for driving traffic.
If your swipe-ups are low, try adding text letting users know to “Swipe up!” or an arrow pointing to the bottom of your screen. There’s also cute “swipe up” Instagram Stories GIFs that you can use! It’s possible your audience may be missing the link and needs a little nudge in the right direction:

Replies
Similar to engagements for photos and videos, replies are the number of times someone has directly responded to a portion of your story. But unlike comments on a photo or video, these responses end up in your inbox and don’t appear publicly.
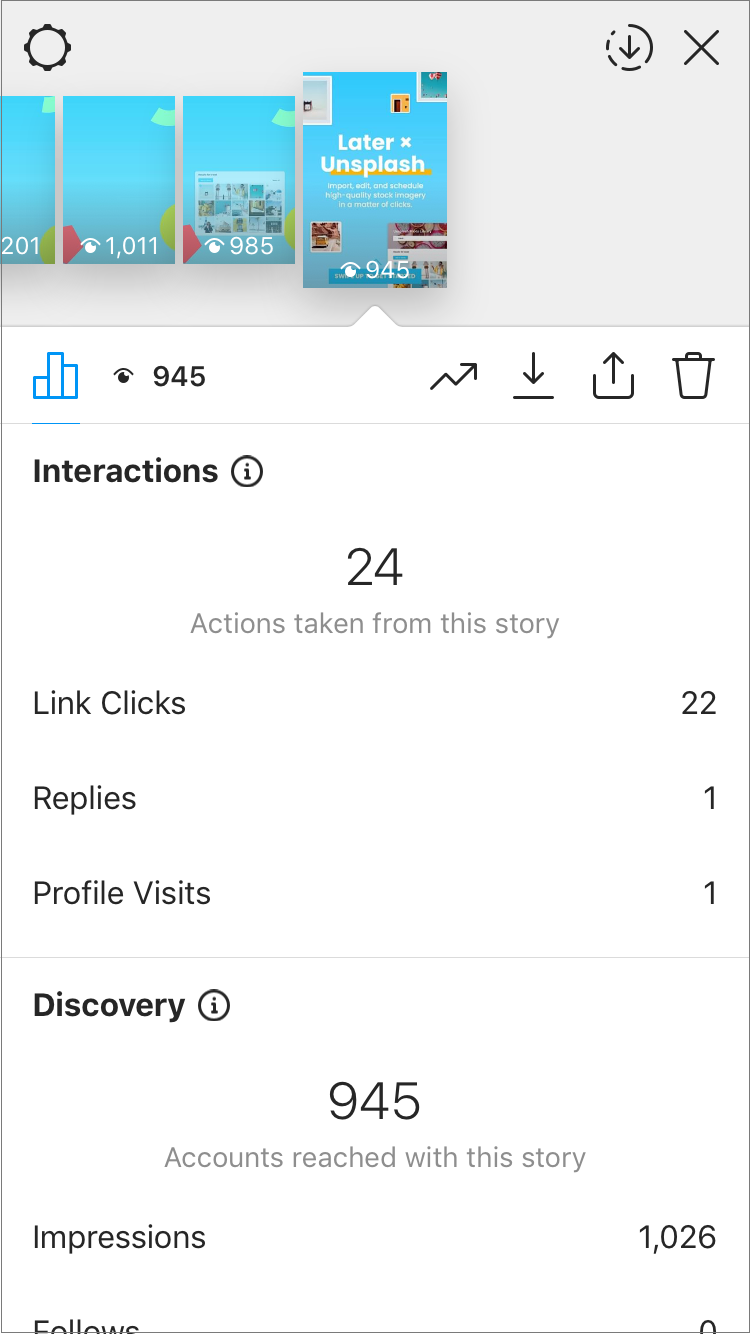
Creating Instagram Stories that encourage followers to reply is a great way to boost your overall engagement!
Pay close attention to what content drives your audience to connect with you, and continue to take advantage of these opportunities to connect with your followers in the future!
These interactions will not only help keep your Instagram Stories at the top of your followers’ feeds but will help drive deeper connections with your audience.
Measuring Hashtag & Location Stickers with Instagram Stories Analytics
Instagram Stories analytics also show you the number of taps on stickers, making it easier to evaluate their performance in your Instagram Stories! You’ll be able to see how many people clicked on each sticker, which can help you understand if they’re useful to your audience or not.
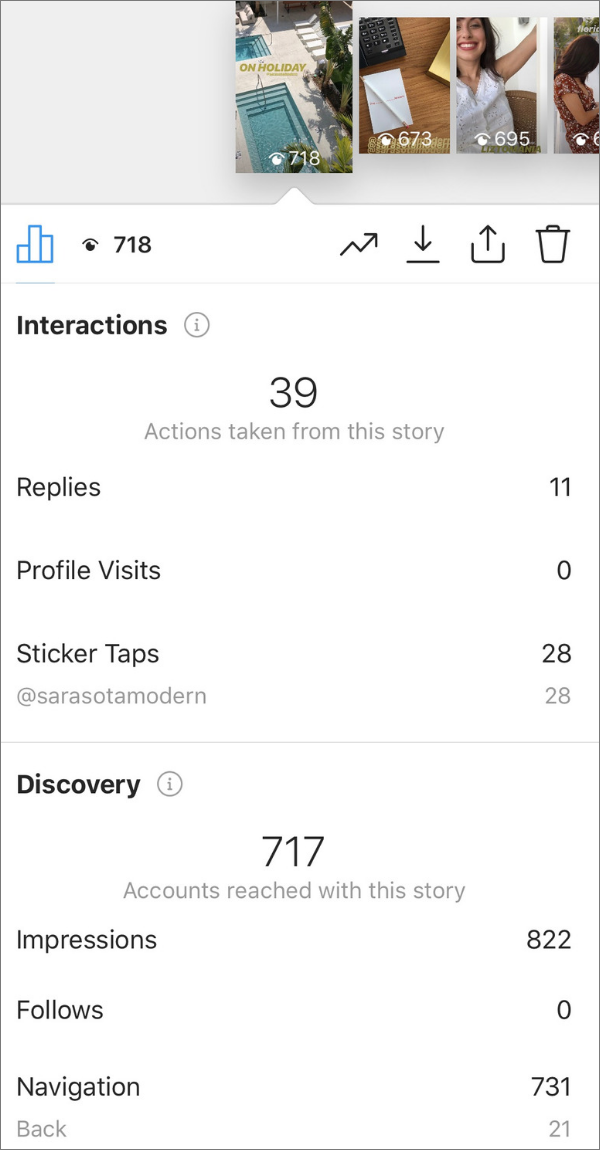
Recently, Instagram expanded the Search & Explore page to include hashtag and location Stories. Now when you add a hashtag or location sticker to a story, other users will be able to find it if they search it on the Explore page. This means that your stories are now discoverable by anyone on the platform!
Measuring Discovery with Instagram Stories Analytics
If your story gets featured in a hashtag or location story by Instagram, you can also track the number of viewers who viewed it through the Explore page!
When your story is added to the search results for a location, Instagram lets you know by sending you a notification, or you can view it at the top of your story. When someone views your story from a hashtag or location page, you’ll see the name of that page when looking at who watched your story in your Instagram Stories analytics.
You can also view how many times your Instagram Stories are being shared by your followers. If you notice your story has lots of shares, it’s safe to say you sparked your followers’ interest and should take note of the “shareable” content:
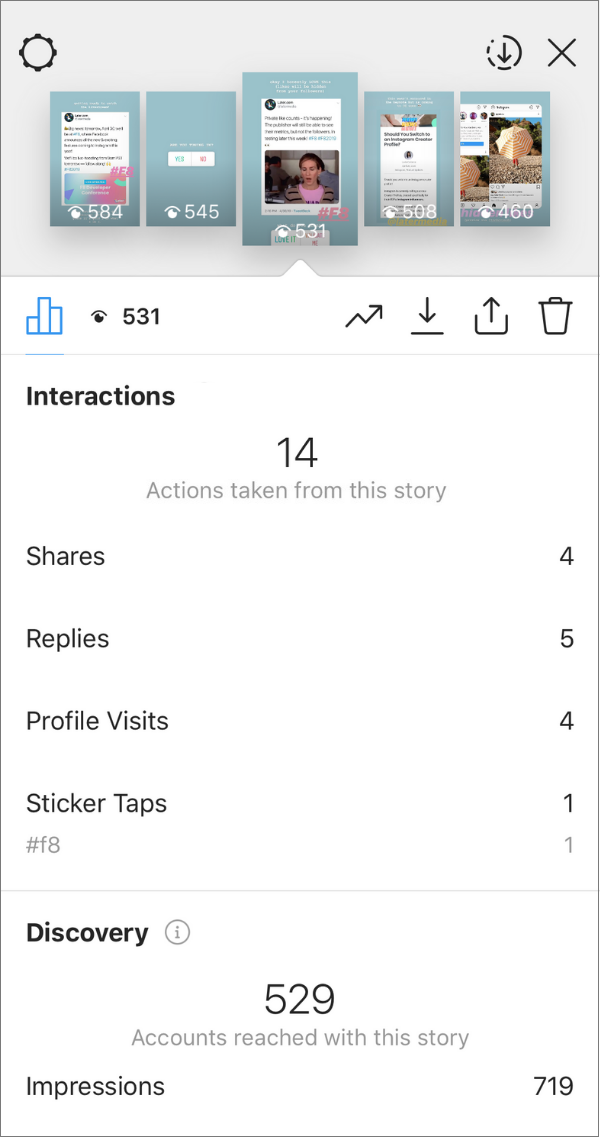
This gives you the opportunity to reach tons of new and undiscovered audiences with your Instagram Stories. And if they like what they see, they might even give you a follow!
How to Track Traffic from Instagram Stories
As Instagram Stories continues to grow in popularity, it’s important for businesses and brands to look at their feed and stories as two separate platforms. While the strategy and content for your feed and stories should work together, it’s important to track traffic and other important KPIs separately to figure out what works best for each of these audiences.
Creating trackable links is a great way to keep your analytics separated (and organized), to help you determine exactly where your traffic is coming from!
Setting Up UTM Tracking in Google Analytics
To get started, you’ll want to set up UTM tagging. UTM is short for “Urchin Tracking Module”. To put it in easier terms, a UTM is the piece of unique code you’ll add on to the end of your URL. With UTM tagging, you can make sure Google Analytics is tracking your Instagram traffic with complete accuracy.
First, decide what website or specific webpage you want to send your followers to. It’s best to send your audience to a website they can take a “next step” — whether that be signing up for a service, making a purchase, or to simply continue the conversation.
For example, if you running a new campaign and want to get more sign-ups, you can send them to a landing page on your website:

Next, Google Analytics lets you tag your URL with the following three campaign parameters and their values. You can add parameters (such as utm_source, utm_medium, and utm_campaign) to a URL to capture reporting data about the referring campaign.
For example, the following link would allow you to identify the traffic to later.com that came from Instagram, as part of a particular campaign:
https://later.com?utm\_source=instagram&utm\_medium=social&utm\_campaign=spring-campaign
Note: Google Analytics is case sensitive so make sure you’re consistent in naming your sources!
Google Campaign URL Builder to Create Custom URLs
Feeling confused? Not to worry!
Luckily, Google has created a Campaign URL Builder to do all the work for you! Google’s Campaign URL Builder allows you to easily add campaign parameters to URLs so you can track custom campaigns on your Google Analytics Dashboard.
All you have to do is fill out the form, and Google will create a custom URL for your Instagram Stories:
Now you’re all set! Once you’ve added the link to Instagram, you can start to track traffic from each individual link on your Google Analytics Dashboard.
Luckily, with Later’s Instagram Stories scheduler, you can create trackable links for your Instagram Stories to monitor traffic and sales from Instagram! Later makes it easy to keep track of those long URLs, so you never have to scramble to find the right link again.
Simply drag and drop stories onto Later’s storyboard tool, and then re-arrange them to fit the order and look that you want.
From here, you can add links or captions to your scheduled stories, which will be copied to your phone when it’s time to post.
From there, all you have to do is schedule your story by selecting the time and date from the drop-down menu beside the Save Story button.
And you’ll get a notification on your phone when it’s time to post!
Scheduling Instagram Stories doesn’t just save you time, it also helps you create better stories by planning ahead and optimizing your stories for traffic or sales using analytics, CTAs, and trackable URLs (that you no longer need to keep track of!).
Diving into your Instagram Stories analytics is more than just finding out which photo, video, or story performed best.
Truly understanding how your content performs — by tracking key Instagram metrics over time — is the key to developing a content strategy that works for your business!
For example, if you’re running an Instagram account for an online ecommerce store, you may want to investigate how different product photos perform against each other. You might have some product photos on a white background, some on a dark background, and others out in nature or the city.
From here, you can then compare all product shots against your lifestyle content to find out which posts your followers like best!
If you find that your audience is more interested in product content, you may decide to invest more heavily in product photoshoots and scale back on the lifestyle photoshoots.
Since many factors can affect your day-to-day success, testing different types of content and Instagram Stories features can help you identify trends, monitor “wins,” and help you create a fine-tuned Instagram Stories strategy that truly resonates with your audience.
Whatever category your Instagram account falls into, tracking into your Instagram analytics allows you to better understand your audience’s wants, improve your content, and ultimately drive more traffic and sales!

Now that you understand what the different Instagram Stories metrics mean, you’re ready to optimize your Instagram Stories strategy!
In addition to the metrics above, keep in mind the time of day, type of content, length of the story, and other factors that may be contributing to your Instagram Stories performance.
While Instagram Stories analytics provides you with the data, it’s up to you to keep testing and tweaking your content strategy!
**Later’s Instagram Stories scheduler is available now on all paid plans. Upgrade now to get access or start scheduling stories!**
